
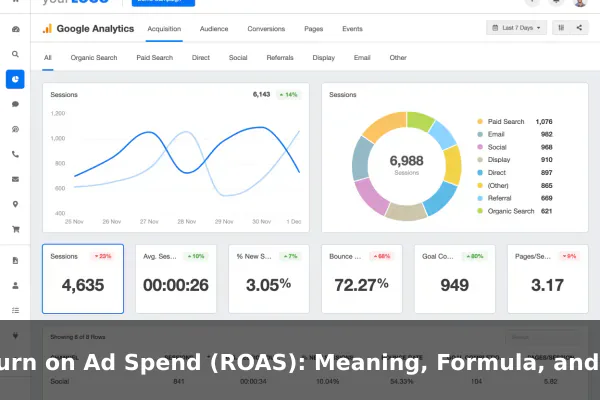
Return on Ad Spend, usually shortened to ROAS, is one of the most practical metrics in advertising because it answers a direct business question: how much revenue did a campaign generate for every dollar spent on ads? Marketers, founders, ecommerce operators, and media buyers use it to judge efficiency, compare campaigns, and decide where budget should go next.
At first glance, ROAS looks simple. The core formula is easy to remember, and the result is easy to communicate. If a campaign brings in $5,000 from $1,000 in ad spend, the ROAS is 5.0 or 5:1. That clarity is exactly why the metric is popular. But using ROAS well requires more than plugging numbers into a formula. You also need to understand what counts as revenue, which costs are included, how margins affect decisions, and why a “good” ROAS depends on context.
This article explains Return on Ad Spend (ROAS) in plain language, breaks down the formula step by step, and walks through realistic examples from different campaign types. It also shows where marketers misread ROAS, how it differs from ROI, and how to improve it over time without making short-sighted decisions.
What Return on Ad Spend (ROAS) Means
ROAS is a marketing metric that measures the revenue earned from advertising relative to the cost of that advertising. In simple terms, it shows how efficiently your ad budget is producing sales or other monetized results.
When someone says a campaign has a ROAS of 4, they usually mean the business earned $4 in revenue for every $1 spent on ads. That does not automatically mean the campaign was highly profitable, but it does mean the advertising itself generated a strong revenue multiple relative to media cost.
Why marketers rely on ROAS
ROAS is widely used because it helps answer decisions that come up every day in marketing:
- Which campaign deserves more budget?
- Which audience segment is more efficient?
- Which ad creative is producing stronger returns?
- Which channel is driving revenue at an acceptable cost?
- Whether a campaign is improving or deteriorating over time?
Unlike broad awareness metrics such as impressions or reach, ROAS tries to connect spending directly to business output. That makes it especially useful in performance-driven environments such as ecommerce, lead generation, app installs with monetization, and subscription acquisition.
What ROAS measures and what it does not
ROAS measures revenue generated from ads divided by ad spend. It does not automatically account for profit margins, product costs, salaries, software fees, fulfillment, discounts, returns, or overhead. This is the first place many beginners get confused.
A campaign can have a high ROAS but still be disappointing for the business if the product margin is thin. On the other hand, a campaign with a lower ROAS may still be strategically valuable if it acquires high-value customers or supports long-term growth.
That is why ROAS works best when you treat it as a performance efficiency metric, not as the only measure of business success.
ROAS Formula Explained Step by Step
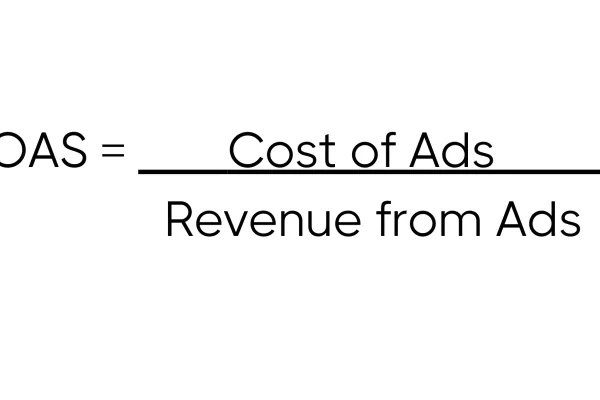
The standard ROAS formula is straightforward:
ROAS = Revenue Attributed to Ads / Cost of Ads
To calculate it correctly, you need to define both parts clearly. The formula becomes useful only when the numbers are consistent and the attribution logic is reasonable.
The standard formula in plain language
If you spent $2,000 on a campaign and that campaign generated $8,000 in attributed revenue, the formula looks like this:
ROAS = 8,000 / 2,000 = 4
This means the campaign returned four dollars in revenue for every advertising dollar spent.
Many teams express ROAS in one of three ways:
- Ratio: 4:1
- Decimal: 4.0
- Revenue multiple wording: “four times ad spend”
All three communicate the same idea. In most marketing dashboards, the decimal format is the most common.
How to convert ROAS into percentage form
Some marketers also convert ROAS into a percentage by multiplying the decimal by 100. Using the previous example:
ROAS = 4.0 = 400%
This means revenue was 400% of ad spend. While that format is mathematically valid, it can sometimes confuse readers because people may mix it up with ROI. For that reason, many practitioners prefer the ratio or decimal form for ROAS and reserve percentage language for ROI.
What counts as revenue
The revenue side of the formula usually includes sales or conversion value attributed to the ad campaign. Depending on the business model, that could mean:
- Online purchase revenue from ecommerce orders
- Subscription revenue from first payments
- Estimated lead value in a lead generation funnel
- In-app purchase revenue
- Phone-call conversions with assigned revenue values
The important part is consistency. If one campaign uses gross order value and another uses net revenue after refunds, the comparison becomes distorted.
What counts as ad spend
The cost side usually includes the direct media spend paid to platforms such as search, social, retail media, or display networks. In many day-to-day ROAS discussions, this is the only cost included.
However, some businesses calculate a broader version that also includes certain advertising-related costs such as:
- Agency management fees
- Creative production costs
- Tracking or ad automation software tied to the campaign
- Affiliate commissions
There is no single universal rule, but you should label the metric clearly. If you only use platform spend, say so. If you include management or production costs, say that too. A clean definition avoids misleading comparisons.
Simple ROAS Examples for Different Campaigns
Examples make the concept easier to understand because the formula stays the same while the business context changes. Below are simple ROAS examples from different campaign types.
Example 1: Ecommerce search ads
An online store spends $1,500 on search ads promoting a high-intent product category. The ads generate $6,000 in attributable revenue.
ROAS = 6,000 / 1,500 = 4.0
That means the campaign produced 4:1 ROAS. For every dollar spent, the store generated four dollars in revenue.
If the store sells products with strong margins, that may be excellent. If margins are low and shipping is expensive, the result may be less impressive than it first appears.
Example 2: Social media lead generation
A B2B company spends $3,000 on paid social campaigns and collects 120 leads. Its sales team knows that each qualified lead is worth an average of $75 in revenue based on historical close rates.
Estimated revenue becomes:
120 x 75 = $9,000
Now calculate ROAS:
ROAS = 9,000 / 3,000 = 3.0
This campaign has a 3:1 ROAS. In lead generation, revenue is often modeled or estimated instead of observed immediately, which makes data quality and attribution especially important.
Example 3: Remarketing campaign
A brand runs remarketing ads to previous website visitors. It spends $500 and tracks $2,750 in revenue.
ROAS = 2,750 / 500 = 5.5
This looks better than the previous examples, and remarketing often does produce stronger ROAS because the audience already knows the brand. But marketers should be careful not to compare remarketing and cold-audience campaigns as if they serve the same role. One is harvesting demand; the other may be creating it.
Example 4: New product launch campaign
A company spends $4,000 promoting a newly launched product and brings in $8,000 in direct revenue.
ROAS = 8,000 / 4,000 = 2.0
At first glance, a 2.0 ROAS may look weaker than the earlier campaigns. Yet for a new launch, this might still be acceptable if the goals include market entry, learning, audience building, or repeat purchases after the initial sale.
A quick comparison of the examples
- The formula stays the same across all campaign types.
- The meaning of “good” changes based on margins, goals, and customer value.
- Higher ROAS is not always better if it comes from overly narrow scaling or brand-only demand capture.
- Lower ROAS is not automatically bad if the campaign supports long-term growth.
How to Interpret a Good or Bad ROAS
One of the most common questions in marketing is, “What is a good ROAS?” The honest answer is that there is no universal ideal number. A good ROAS depends on what you sell, how much margin you keep, how mature the campaign is, and what your business is trying to achieve.
Break-even ROAS matters more than generic benchmarks
The most useful starting point is your break-even ROAS. This is the minimum ROAS required for the campaign to cover its costs at the revenue level you are measuring.
For example, if your gross margin is 25%, you may need a much higher ROAS than a business with 70% margins. If a product produces only a small amount of profit per order, even a campaign that looks efficient on the surface may not be sustainable.
That is why businesses should calculate answers like these:
- What ROAS covers ad spend and cost of goods sold?
- What ROAS supports a target contribution margin?
- What ROAS is acceptable for customer acquisition versus remarketing?
Campaign goals change the interpretation
ROAS should always be interpreted in light of the campaign objective.
A campaign focused on immediate purchases will usually be judged more strictly on ROAS than a campaign focused on:
- Testing new audiences
- Launching a new offer
- Entering a new market
- Building a retargeting pool
- Acquiring first-time customers with high repeat potential
In other words, the same number can be strong in one situation and weak in another. A 2.5 ROAS may be disappointing for branded search but acceptable for prospecting into a competitive category.
Industry and business model affect expectations
Ecommerce brands, software companies, local service businesses, and media publishers do not evaluate ROAS in the same way. Some businesses care about first-order revenue. Others care about subscription retention, repeat purchase behavior, or lifetime value.
If a business knows that newly acquired customers frequently buy again over the next 12 months, it may willingly accept a lower first-purchase ROAS because the long-term value is strong. A business with one-time purchases and thin margins usually cannot make the same decision.
Why platform benchmarks should be used carefully
Marketers often search for average ROAS benchmarks, but benchmark numbers are easy to misuse. They can vary based on attribution windows, brand strength, creative quality, conversion lag, seasonality, and channel mix. A benchmark may offer rough orientation, but it should never replace understanding your own economics.
The better question is not “What is the average ROAS in my industry?” but rather “What ROAS makes this campaign worthwhile for this business?”
ROAS vs ROI: What Is the Difference
ROAS and ROI are related, but they are not the same metric. Confusing them leads to bad reporting and poor decisions.
ROAS focuses on ad efficiency
ROAS looks at how much revenue advertising generates compared with ad spend. It is narrow by design. That makes it useful for managing campaigns, channels, and media budgets.
Formula: Revenue from ads / Ad spend
ROI focuses on overall return
ROI measures profitability relative to the total investment. Depending on the business, that can include product cost, labor, tools, agency fees, shipping, and other expenses.
Formula: (Net profit / Total investment) x 100
So while ROAS asks, “Did the ads produce revenue efficiently?” ROI asks, “Did this investment actually create profit?”
A simple side-by-side example
Imagine a campaign that generates $10,000 in revenue from $2,000 in ad spend.
ROAS = 10,000 / 2,000 = 5.0
That looks strong. But now include other costs:
- Cost of goods sold: $4,500
- Agency fee: $800
- Creative cost: $400
- Shipping and handling: $700
Total costs become $8,400. Net profit is $1,600.
ROI = 1,600 / 8,400 x 100 = 19.05%
The campaign still worked, but the story is different. ROAS says the ad spend was efficient. ROI says the final profitability was much tighter.
When to use each metric
- Use ROAS for campaign optimization, channel comparison, and media buying decisions.
- Use ROI for broader business evaluation, budgeting, and profitability planning.
- Use both together when you want a fuller picture.
Common ROAS Mistakes to Avoid
ROAS becomes misleading when marketers use it too casually. Many reporting mistakes come from incomplete cost tracking, weak attribution, or interpreting the number without business context.
Ignoring margins and contribution
A high ROAS does not guarantee a healthy business result. If margins are low, refund rates are high, or average order values are small, a campaign can look strong on paper while contributing little profit.
This is one reason experienced marketers often pair ROAS with margin analysis, blended acquisition cost, or contribution profit reporting.
Counting only platform spend when broader cost matters
If your decision is purely about platform efficiency, media-only ROAS can be enough. But if you are evaluating whether the campaign truly makes sense commercially, excluding management fees, creative costs, or affiliate payouts can inflate the picture.
The solution is not to force one definition on every team. The solution is to define the version clearly and use it consistently.
Judging campaigns too early
Some campaigns need time before their real value appears. This is especially true when:
- Customers convert after multiple visits
- Longer sales cycles are involved
- Attribution windows are short
- Learning phases are still underway
Pulling budget too early can punish campaigns that need more time to mature. At the same time, waiting too long can waste spend. Good judgment comes from knowing the normal conversion lag of the business.
Trusting attribution blindly
ROAS is only as reliable as the attribution behind it. Platform-reported revenue can overstate performance if multiple systems claim the same conversion, view-through effects are generous, or tracking is incomplete.
That does not make ROAS useless. It means marketers should compare platform data with analytics tools, CRM records, or backend sales data whenever possible.
Comparing unlike campaigns
Prospecting campaigns, brand campaigns, remarketing campaigns, and product-specific promotions often play different roles. Comparing their ROAS directly without acknowledging intent can lead to distorted conclusions.
A lower-ROAS prospecting campaign may be the reason high-ROAS remarketing campaigns keep working. Looking only at the final touchpoint can hide that relationship.
Ways to Improve ROAS Over Time
Improving ROAS usually requires better alignment between audience, message, offer, and conversion experience. It is rarely fixed by one tactic alone.
Refine targeting and audience quality
If the wrong people see the ad, even great creative will struggle. Better targeting can improve relevance, reduce waste, and lift conversion efficiency.
- Exclude low-intent audiences
- Separate new and returning users
- Use high-performing customer segments as lookalikes where relevant
- Align keywords or audience signals with clear purchase intent
Improve creative and message match
ROAS often improves when the ad promise matches what the user actually wants. Creative should make the offer clear, reduce uncertainty, and highlight the reason to act now.
Common improvements include:
- Stronger product imagery or demonstrations
- Clearer value proposition in the first seconds or first line
- Better differentiation from competitors
- More precise call to action
Increase conversion rate on the landing page
You can improve ROAS without lowering ad spend if more visitors convert after they click. That makes landing page quality a major lever.
- Speed up the page
- Simplify the form or checkout flow
- Improve trust elements such as reviews, guarantees, or proof points
- Match landing page copy to the ad message
- Reduce distractions and unclear navigation paths
Raise average order value where appropriate
Since ROAS uses revenue in the numerator, increasing revenue per conversion can improve the metric even if traffic costs stay similar.
Examples include:
- Bundling complementary products
- Adding upsells or cross-sells
- Using free-shipping thresholds
- Promoting higher-margin product mixes
Shift budget toward proven efficiency
Budget allocation matters. Many accounts contain a small number of campaigns, audiences, or products that drive a disproportionate share of revenue. Regularly reviewing performance helps identify where more spending is justified and where cuts are necessary.
That said, over-concentrating budget can limit future growth. A balanced approach protects top performers while leaving room for structured testing.
Test methodically instead of changing everything at once
When marketers panic over ROAS, they often edit too many variables at the same time. That makes it hard to learn what actually improved results.
A more disciplined process is better:
- Identify the weakest point in the funnel.
- Choose one meaningful hypothesis.
- Test it with enough data to matter.
- Keep what improves efficiency and discard what does not.
Key Takeaways Before You Use ROAS
Before using ROAS to guide spending decisions, keep these principles in mind:
- ROAS measures revenue efficiency, not full profitability.
- The formula is simple, but the definitions behind it must be consistent.
- A good ROAS depends on margins, business goals, and campaign role.
- ROAS and ROI serve different purposes and should not be treated as interchangeable.
- Attribution quality can dramatically affect the final number.
- The best use of ROAS is comparative and decision-oriented, not purely descriptive.
If you are reporting ROAS inside a team, it helps to establish a short checklist:
- What revenue source is being used?
- What costs are included in ad spend?
- What attribution model or platform is behind the number?
- What campaign objective are we evaluating against?
- What break-even or target ROAS does the business actually need?
When those questions are answered clearly, ROAS becomes much more actionable and much less likely to be misunderstood.
Conclusion
Return on Ad Spend (ROAS) is valuable because it translates ad performance into a language businesses care about: revenue relative to spend. It is easy to calculate, useful for comparing campaigns, and practical for day-to-day budget decisions. That simplicity is its strength.
But the metric becomes truly useful only when it is interpreted in context. ROAS does not replace profit analysis, margin awareness, or sound attribution. Instead, it works best as part of a broader decision system that asks not only whether ads generated revenue, but whether that revenue supports sustainable growth.
Used correctly, ROAS helps marketers move beyond vanity metrics and focus on economic performance. If you know your formula, define your inputs carefully, and compare results against real business goals, ROAS can become one of the clearest indicators in your marketing toolkit.
