
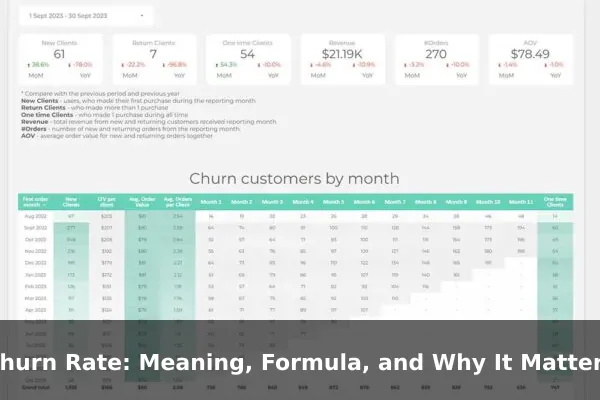
Churn rate is one of the clearest signals of whether a business is keeping the customers it works hard to win. It measures the percentage of customers who stop buying, cancel a subscription, or otherwise leave during a specific period. On the surface, that sounds simple. In practice, churn rate influences growth, profitability, forecasting, pricing decisions, and even how aggressively a company can spend on acquisition.
For subscription businesses, software companies, membership brands, and service providers with repeat customers, churn is not just a customer service issue. It is a business health metric. A company can produce strong sales numbers and still struggle if too many customers leave after the first month, first contract, or first renewal cycle. In that situation, new revenue keeps filling a bucket that has a leak.
This article explains churn rate in plain English, shows the standard formula, walks through easy examples, and explains why the metric matters far beyond retention reporting. You will also learn the difference between customer churn and revenue churn, what makes a churn rate look good or bad, common measurement mistakes, and practical ways businesses use churn data to make better decisions.
What Churn Rate Means in Business
Churn rate refers to the share of customers a business loses over a defined period, such as a month, quarter, or year. The period matters because churn is not an absolute number. Losing 50 customers in one month means something very different for a company that started with 500 customers than for one that started with 50,000.
The basic meaning of churn
At its core, churn answers a simple question: How many existing customers did we fail to keep? That is why churn rate is usually discussed alongside retention. Retention shows how many customers stayed. Churn shows how many left. Together, they give a clearer picture of loyalty, satisfaction, product fit, and revenue stability.
Businesses often track churn when they depend on recurring relationships rather than one-time transactions. Examples include:
- Software as a service companies with monthly or annual plans
- Streaming platforms and subscription boxes
- Gyms, clubs, and membership organizations
- Agencies and service firms with recurring contracts
- Ecommerce brands with repeat-purchase programs
Even businesses without formal subscriptions can still measure churn by defining what “lost customer” means. For example, a retailer may classify a customer as churned after six or twelve months without a repeat purchase.
Customer churn vs. revenue churn
A major source of confusion is that churn can be measured in more than one way. Customer churn focuses on the number of customers lost. Revenue churn focuses on the amount of recurring revenue lost. These are related, but not identical.
Imagine a software company loses five small accounts and one large enterprise account. Customer churn might look modest, but revenue churn could be severe. On the other hand, a company might lose many low-value users while keeping its highest-paying customers, making revenue churn less dramatic than logo loss suggests.
That is why mature businesses usually monitor both:
- Customer churn: best for understanding account loss and loyalty trends
- Revenue churn: best for understanding the financial impact of customer loss
- Net revenue churn: useful when upgrades and expansions can offset some lost revenue
Why churn is a strategic metric, not just a support metric
It is tempting to treat churn as a support or satisfaction problem alone, but that view is too narrow. Churn often reflects multiple business issues at once, including weak onboarding, poor targeting, pricing mismatch, unmet expectations, low product adoption, and weak renewal processes. In other words, churn is not only about how customers leave. It also reveals why growth becomes harder than expected.
The Churn Rate Formula Explained
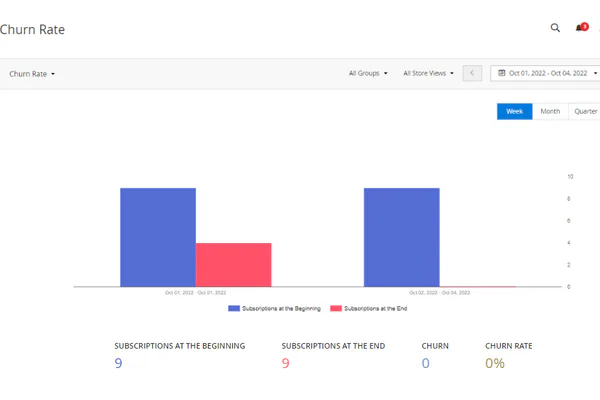
The standard churn rate formula is straightforward, but the details behind each number matter. A small definition mistake can produce a misleading result, especially when comparing months or reporting to leadership.
The standard customer churn formula
Churn Rate = (Customers Lost During the Period / Customers at the Start of the Period) x 100
Each part has a specific meaning:
- Customers lost during the period: customers who canceled, did not renew, or became inactive based on your churn definition
- Customers at the start of the period: the total active customers before that period began
- x 100: converts the result into a percentage
The most important rule is that the starting customer count should be the base. Many people mistakenly divide by the end-of-period total or by the average number of customers in the month, which changes the meaning of the metric.
How the time period changes the result
Churn can be measured monthly, quarterly, or annually. The right timeframe depends on the business model. A monthly subscription service usually watches monthly churn closely. A company with annual contracts may care more about quarterly and yearly churn because most cancellations happen around renewal dates.
For example, a 2% monthly churn rate and a 2% annual churn rate are not remotely equivalent. The monthly figure implies a much faster loss of customers over time. That is why churn should always be reported with a clear time label, such as:
- Monthly customer churn
- Quarterly revenue churn
- Annual logo churn
Without the time frame, the number is incomplete and easy to misinterpret.
Revenue churn and net revenue churn formulas
When a business has accounts with very different values, revenue-based churn formulas add essential context.
Revenue Churn Rate = (Recurring Revenue Lost During the Period / Recurring Revenue at the Start of the Period) x 100
This version tracks how much recurring revenue disappeared because of cancellations, downgrades, or non-renewals.
Some companies go a step further and calculate net revenue churn, which accounts for expansion revenue from existing customers.
Net Revenue Churn = (Revenue Lost – Expansion Revenue) / Starting Recurring Revenue x 100
If expansion revenue exceeds lost revenue, net revenue churn can even become negative. That means the existing customer base generated more revenue overall despite some churn. This is one reason software and subscription businesses often pay close attention to revenue churn rather than customer count alone.
A simple process for calculating churn correctly
- Choose a clear period, such as one month or one quarter.
- Define what counts as churn for your business.
- Count active customers at the start of the period.
- Count how many of those customers churned during the period.
- Divide lost customers by starting customers.
- Multiply by 100 to express the result as a percentage.
Consistency matters more than complexity. A simple formula applied consistently over time is more useful than a sophisticated formula that changes from one report to the next.
Simple Example of How to Calculate Churn Rate
Once the formula is clear, the calculation becomes much easier to apply. A basic example helps remove the ambiguity.
Monthly customer churn example
Suppose a subscription business starts April with 1,000 active customers. During the month, 60 customers cancel. Using the standard formula:
Churn Rate = (60 / 1,000) x 100 = 6%
That means the company lost 6% of the customer base it had at the beginning of April.
If the business also added 120 new customers during the month, those new signups do not change the churn calculation itself. They affect total customer growth, but churn is still based on the customers who were already there at the start.
This distinction is important because many teams accidentally blur growth and churn together. A company can post positive net growth while still having a churn problem. If acquisition slows down later, that underlying weakness becomes much more visible.
Revenue churn example
Now imagine the same company began the month with $50,000 in monthly recurring revenue. During April, it lost $4,000 in recurring revenue from cancellations and downgrades.
Revenue Churn Rate = ($4,000 / $50,000) x 100 = 8%
Notice that revenue churn is higher than customer churn in this example. That tells you the lost accounts were, on average, more valuable than the typical customer. If leadership only looked at customer count, they would underestimate the financial damage.
How to interpret the number
A churn rate by itself is only the start of analysis. To interpret it properly, ask follow-up questions such as:
- Is the rate improving or getting worse over time?
- Is churn concentrated in certain plans, products, or customer segments?
- Did the business lose many low-value customers or a few high-value ones?
- Is churn happening early after signup or later at renewal?
- Did a pricing change, product issue, or support problem contribute?
The value of churn reporting comes less from the percentage alone and more from the story behind the percentage. The number tells you there is movement. The segment analysis tells you what to fix.
Why Churn Rate Matters
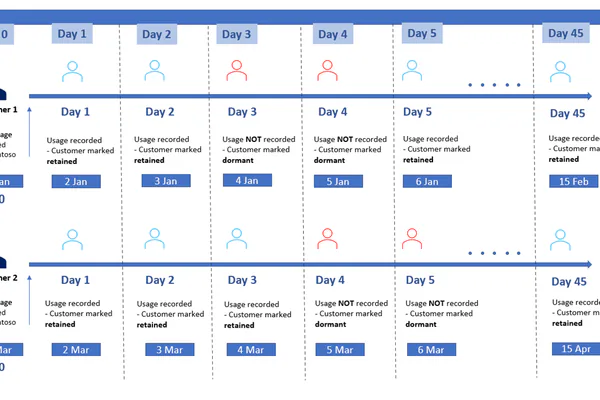
Churn rate matters because customer loss affects far more than retention dashboards. It influences growth speed, marketing efficiency, revenue quality, and confidence in future planning. A business with stable acquisition but high churn often feels like it is running hard without gaining much ground.
Churn affects growth quality
Growth looks stronger when more customers stay. If a company acquires 200 new customers but loses 180 existing ones, the headline acquisition figure looks impressive while the actual progress is weak. High churn forces the business to replace lost customers constantly before it can grow at all.
This is why churn rate is often described as a drag on growth. Lower churn means every new customer adds more lasting value. Higher churn means the company must keep spending just to stand still.
Churn changes the economics of acquisition
Customer acquisition costs make less sense when customers leave too quickly. If a business pays to acquire a customer and that customer churns before generating enough profit, the acquisition model becomes fragile. This is one reason churn is closely connected to customer lifetime value, even though the two metrics are not the same.
In practical terms, a lower churn rate usually means:
- Longer customer relationships
- Higher average lifetime value
- More room to invest in acquisition
- Better return from onboarding and support efforts
- More reliable expansion and upsell opportunities
A high churn rate has the opposite effect. It compresses the value of every acquired customer and narrows the margin for marketing mistakes.
Churn influences forecasting and revenue stability
Recurring revenue businesses depend on predictability. When churn is stable and well understood, finance and leadership teams can forecast more accurately. They can estimate how much revenue is likely to remain, how much new business is needed, and how realistic growth targets are.
When churn is volatile or poorly measured, forecasting becomes much harder. Revenue plans may look strong on paper but fail in practice because the customer base is leaking faster than expected. In that sense, churn is not just a retention metric. It is a planning metric.
Churn reveals product and market fit issues
One of the most valuable things about churn is that it exposes whether customers continue seeing value after the initial sale. A business may have persuasive marketing and a capable sales team, but if customers leave quickly, the offer may not be delivering what buyers expected.
That is why churn often acts as an early warning system. A rising churn rate can point to:
- Mismatched customer targeting
- Weak onboarding
- Confusing product experience
- Poor service quality
- Pricing that does not match perceived value
- Competitive pressure
Viewed this way, churn is a feedback mechanism for the whole business.
What Counts as a Good or Bad Churn Rate
There is no universal churn number that is good for every company. The right benchmark depends on the industry, contract structure, customer type, and business maturity. That is why generic churn comparisons can be misleading.
Industry and business model matter
A consumer subscription service with low switching costs will usually experience different churn patterns from a business-to-business software platform with annual contracts and complex implementation. Likewise, a premium service with fewer high-value clients may tolerate a very different churn profile than a low-cost membership model built on volume.
Businesses should compare churn rates against companies with similar characteristics, including:
- Pricing model
- Contract length
- Product complexity
- Customer segment
- Purchase frequency
- Switching difficulty
A monthly app subscription and a managed enterprise service are both recurring businesses, but their churn expectations should not be treated the same way.
Stage of growth changes the interpretation
Early-stage companies often experience noisier churn because they are still refining product fit, pricing, and ideal customer profiles. More established businesses typically expect greater stability. A startup may accept temporary churn volatility while learning quickly, but a mature company with a well-defined market has less excuse for unexplained deterioration.
That said, businesses should be careful not to excuse chronic churn as a normal growth-stage problem. If the same customers leave for the same reasons quarter after quarter, the issue is structural, not temporary.
Trend direction often matters more than a benchmark
For internal decision-making, the trend is usually more valuable than a random outside benchmark. A churn rate that falls steadily over six months may indicate strong improvement even if it is still not ideal. A churn rate that rises from 3% to 5% may be more concerning than a static 6% if the business had been improving before.
Useful questions include:
- Is churn improving, flat, or worsening?
- Which customer cohorts behave better or worse?
- Did a pricing or product change affect churn?
- Is revenue churn moving differently from customer churn?
A good churn rate is not just a low number. It is a number the business understands, can explain, and is actively improving.
Common Mistakes When Measuring Churn
Many churn reports look precise but still lead to weak decisions because the underlying method is flawed. Measurement discipline matters.
Using inconsistent definitions
One of the most common mistakes is changing what counts as churn from one period to another. If one report includes paused accounts as churn and the next excludes them, the trend loses credibility. The same problem appears when teams define “active customer” differently across departments.
Agree on a standard definition and document it clearly. Otherwise, the metric becomes a debate instead of a management tool.
Mixing customer churn with revenue churn
Customer churn and revenue churn answer different questions. Combining them without distinction can hide important problems. Losing one major account may barely affect customer churn while badly hurting revenue. Losing many low-spend accounts may do the reverse.
Businesses should report both when account values vary meaningfully.
Using the wrong denominator
The denominator should usually be the number of customers at the start of the period, not the end. Using end-of-period totals can distort the result, especially when many new customers joined during the same period.
This mistake often makes churn look better than it really is because acquisition growth inflates the denominator.
Ignoring downgrades, reactivations, and timing effects
Revenue churn becomes incomplete if downgrades are ignored. Customer churn can also be misread if reactivated accounts are handled inconsistently. Timing matters too. In annual contract businesses, churn may cluster around renewal windows rather than spread evenly each month.
To reduce confusion, businesses should separate:
- Full cancellations
- Downgrades
- Temporary pauses
- Reactivations
- Non-renewals at contract end
These distinctions make analysis slower at first, but much more useful later.
Looking only at the total number
An overall churn rate can hide segment-specific trouble. A flat company-wide rate may mask rising churn in one plan, region, or acquisition channel. If those weak segments grow larger, the problem will eventually show up in the total.
That is why experienced teams break churn down by cohort, source, tenure, pricing tier, and product usage. Aggregate numbers are useful. Segmented numbers are actionable.
How Businesses Actually Use Churn Data
Churn becomes far more valuable when it is used as a decision tool rather than a scoreboard. Strong teams do not just report churn. They connect it to customer behavior, growth planning, and operational changes.
Segmenting churn by customer type
A single churn rate across the whole business is often too broad to guide action. Segmenting churn helps teams find patterns such as:
- Higher churn in low-priced plans
- Lower churn among customers who completed onboarding
- Higher churn from a specific acquisition channel
- Stronger retention in one industry or region
- Better outcomes for customers using key product features
These patterns help marketing, product, and customer success teams prioritize the right fixes instead of guessing.
Identifying early warning signals
Many companies combine churn analysis with behavior data to spot risk before a customer leaves. Examples include falling usage, missed logins, support complaints, failed payments, or incomplete setup steps. When these signals are tracked early, teams can intervene before the account churns.
This moves churn management from reactive to proactive. Instead of studying lost customers after the fact, the business starts protecting accounts while there is still time to change the outcome.
Improving forecasting and target setting
Churn data also sharpens planning. If a company knows how many customers or how much recurring revenue it tends to lose each month, it can set more realistic acquisition and expansion targets. Growth goals become grounded in the actual economics of the customer base.
In that sense, churn is useful not only for retention teams but also for leadership, finance, and marketing. It helps answer a practical question: How much new business do we need after accounting for what we are likely to lose?
How to Reduce Churn Rate
Reducing churn is rarely about one dramatic fix. It is usually the result of improving several parts of the customer experience and business model at the same time.
Strengthen onboarding
Many customers churn early because they never reach the moment where value becomes obvious. Better onboarding helps customers understand the product, use core features, and build habits quickly. A clearer setup flow, faster time to first success, and more guided activation can reduce early churn significantly.
Set better expectations before the sale
Some churn starts before the customer even signs up. If sales pages, ads, or sales conversations overpromise results, the business may attract customers who were never a strong fit. Better positioning and qualification can reduce avoidable churn by bringing in customers whose needs match the offer.
Use feedback and support as retention tools
Support interactions and cancellation reasons are rich sources of churn insight. Businesses should collect feedback systematically, look for repeat patterns, and close the loop with operational changes. If customers repeatedly leave because of the same friction point, that issue should become a product or service priority.
Create renewal and save processes
Not every at-risk customer is permanently lost. Renewal reminders, payment recovery flows, downgrade options, and tailored save offers can preserve accounts that might otherwise leave automatically. These tactics are especially useful when churn is caused by timing, budget pressure, or temporary underuse rather than total dissatisfaction.
Build ongoing customer value, not just initial excitement
Long-term retention depends on continued value delivery. That may involve lifecycle emails, feature education, account reviews, loyalty incentives, usage nudges, or proactive check-ins. The goal is simple: remind customers why staying is worthwhile and help them keep getting results.
Practical churn reduction usually follows this sequence:
- Measure churn consistently.
- Segment it to find patterns.
- Identify the most common causes.
- Fix the highest-impact problems first.
- Track whether the changes improve future cohorts.
That approach is more reliable than treating churn as a vague loyalty problem.
Key Takeaway
Churn rate measures the percentage of customers or recurring revenue a business loses during a given period. The core formula is simple, but the business meaning behind the metric is powerful. It affects growth efficiency, customer lifetime value, forecasting accuracy, and the overall quality of a company’s revenue base.
The most useful way to think about churn is not as a standalone number, but as a signal. A rising churn rate can reveal weak onboarding, poor targeting, pricing mismatch, service issues, or product value gaps. A stable or improving churn rate usually indicates stronger retention foundations and more dependable growth.
For that reason, businesses should calculate churn consistently, separate customer churn from revenue churn, analyze the metric by segment, and use it to guide action rather than just reporting it. When tracked well, churn rate becomes more than a formula. It becomes a practical lens on how sustainable the business really is.
